
In April 2025, the professional academic journal Communications Earth & Environment under Springer Nature published an environmental research paper titled "Logistics analysis related to trade reveals the complexity of the global plastic supply chain" completed by a Chinese team. It stated that in 2022, China produced a total of 81.5 million tons of plastic waste. The incineration rate was 60% (49.13 million tons), the recycling rate was 23% (18.99 million tons), the landfill rate was 14% (11.61 million tons), and the improper management rate, that is, the leakage into the environment, was 2% (1.71 million tons).
Tan Quanyin, the corresponding author of the paper and an assistant researcher at the School of Environment, Tsinghua University, said that plastic production has increased from 2 million tons per year in 1950 to 400 million tons per year in 2022, and is expected to reach 800 million tons per year by 2050.
The following are the core data of this article.
I. Global Plastic Production and Trade (2022)
Total output: 400 million tons, including 362 million tons of virgin resin and 38 million tons of recycled plastic (mechanical recycling).
Raw material sources: 98% of virgin plastics come from fossil fuels (coal 44%, oil 40%, natural gas 8%, coke 5%, others 1%), while only 2% come from biological raw materials.
Total trade volume: 436.66 million tons, including 111 million tons of final products, 71 million tons of raw materials, 30 million tons of additives, and 152 million tons of primary plastics.
Major trading participants:
China is the largest exporter of final plastic products (44.25 million tons, accounting for 45%), and the 28 countries of the European Union are the largest importers (35%).
The 28 EU countries are the largest exporters of plastic raw materials (31%), while China is the largest importer (31%).
II. Plastic Consumption and Application (2022)
Consumption Distribution:
China (20%), the United States (18%), the 28 countries of the European Union (16%), and other Asian regions (12%) are the main consumption areas.
Per capita consumption: 216 kilograms per person in the United States, 129 kilograms per person in Japan, and 86.6 kilograms per person in the 28 countries of the European Union.
Application fields:
Packaging (158.04 million tons), construction (72.05 million tons), automobiles (32.02 million tons), electronic and electrical appliances (28.02 million tons), household and textile (28.01 million tons), agriculture (16.01 million tons), and others (48.03 million tons).
III. Plastic Waste Management (2022)
Total waste volume: 267.68 million tons.
Regional Distribution:
China (81.5 million tons, accounting for 30%), the United States (40.1 million tons), other Asian regions (35 million tons), and the 28 countries of the European Union (30 million tons).
Handling method:
Landfill: 103.1 million tons (40%).
Incineration: 89.99 million tons (34%).
Recycling: 37.96 million tons (global recycling rate 9%).
Improper management (leakage into the environment): 29.6 million tons.
Chinese data:
The incineration rate was 60% (49.13 million tons), the landfill rate was 14% (11.61 million tons), and the improper management rate was 2% (1.71 million tons).
IV. Plastic Inventory and Losses
Total inventory: approximately 115 million tons, mainly concentrated in the construction sector (50%), automotive (18%), and household and textile (13%).
Production losses: 1.342 million tons of virgin plastic were lost during the production stage, and 424,000 tons were lost during the manufacturing stage.
V. Plastic Waste Trade (2022)
Trade volume: 6.66 million tons.
The main participants: The 28 EU countries are the largest net importers (importing 3.48 million tons and exporting 2.62 million tons), and Japan is the second largest exporter (10%).
The global plastic circulation is presented through flow volume.
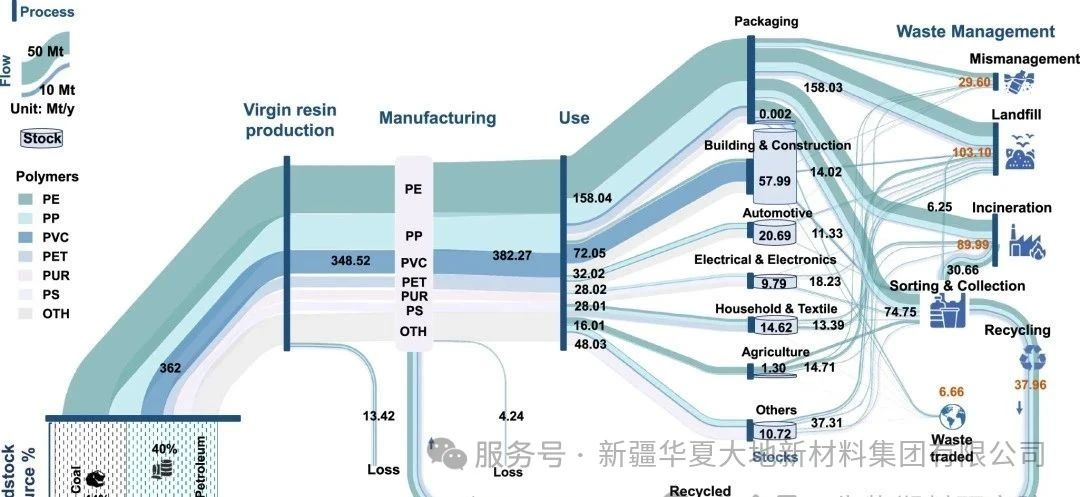
The color and width of the flow represent the type and quality of the plastic respectively. All units are in million tons per year.
Note: The slight differences in the values are due to the rounding-off process in the quality balance calculation.
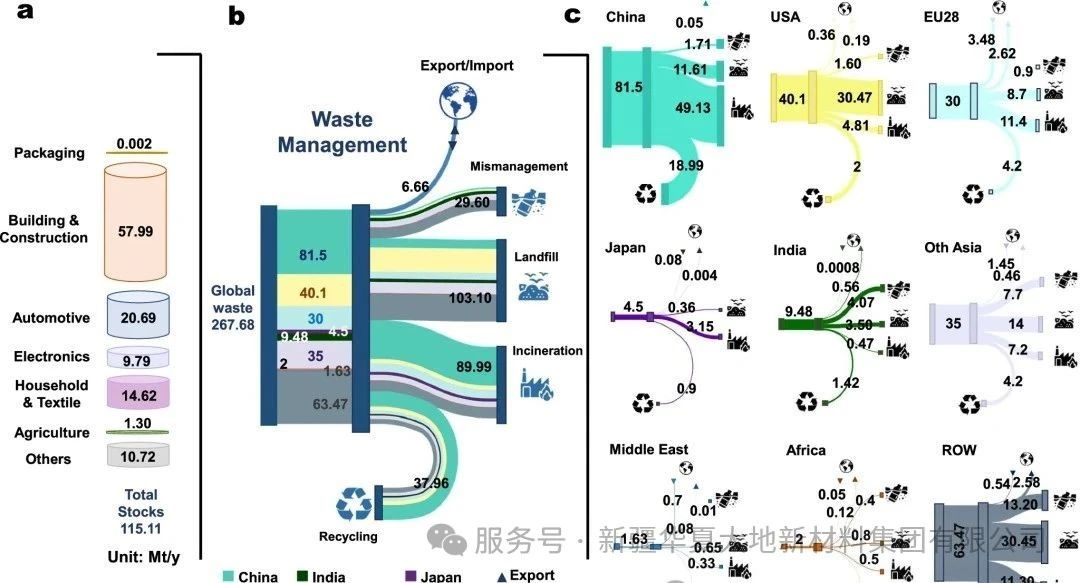
Figure: Global Plastic Waste Generation Situation
The global plastic inventory of each industrial sector
b Global waste management and end-of-life waste situation by country/region
Plastic waste management situation in various regions and countries
(Note: The color and width of the flow represent the quantity of countries and plastic waste respectively. All units are in millions of tons per year. Minor differences in the data are due to rounding during the quality balance calculation process.)
Data source: Khaoula Houssini, Jinhui Li, Quanyin Tan. Revealing the complexities of the global plastics supply chain through a trade-linked material flow analysis. Communications Earth & Environment, 2025, 6:257.
https://doi.org/10.1038/s43247-025-02169-5